This Artist Turns the Forest Floor into Data Visualizations
Julia Cook
18 May 2018
•
8 min read

###Editor’s note: This post was written as part of a collaboration with iDataLabs, a marketing intelligence company. Author Julia Cook works in marketing at iDataLabs.
We’re all familiar with data visualizations — word clouds, pie charts, pivot tables — but how does one put enquiries in paint? Patty Haller, a landscape artist from Seattle WA, may have figured that out. Her training in finance at University of Washington and traditional oil painting at Gage Academy of Art raised more questions than it answered. And in the course of her career, from forester to analyst to artist, Haller has not stopped asking questions of her work. When each shape is a data point, every green space becomes a unique population, and it’s her job to find the patterns.
How do you identify a subject before you start?
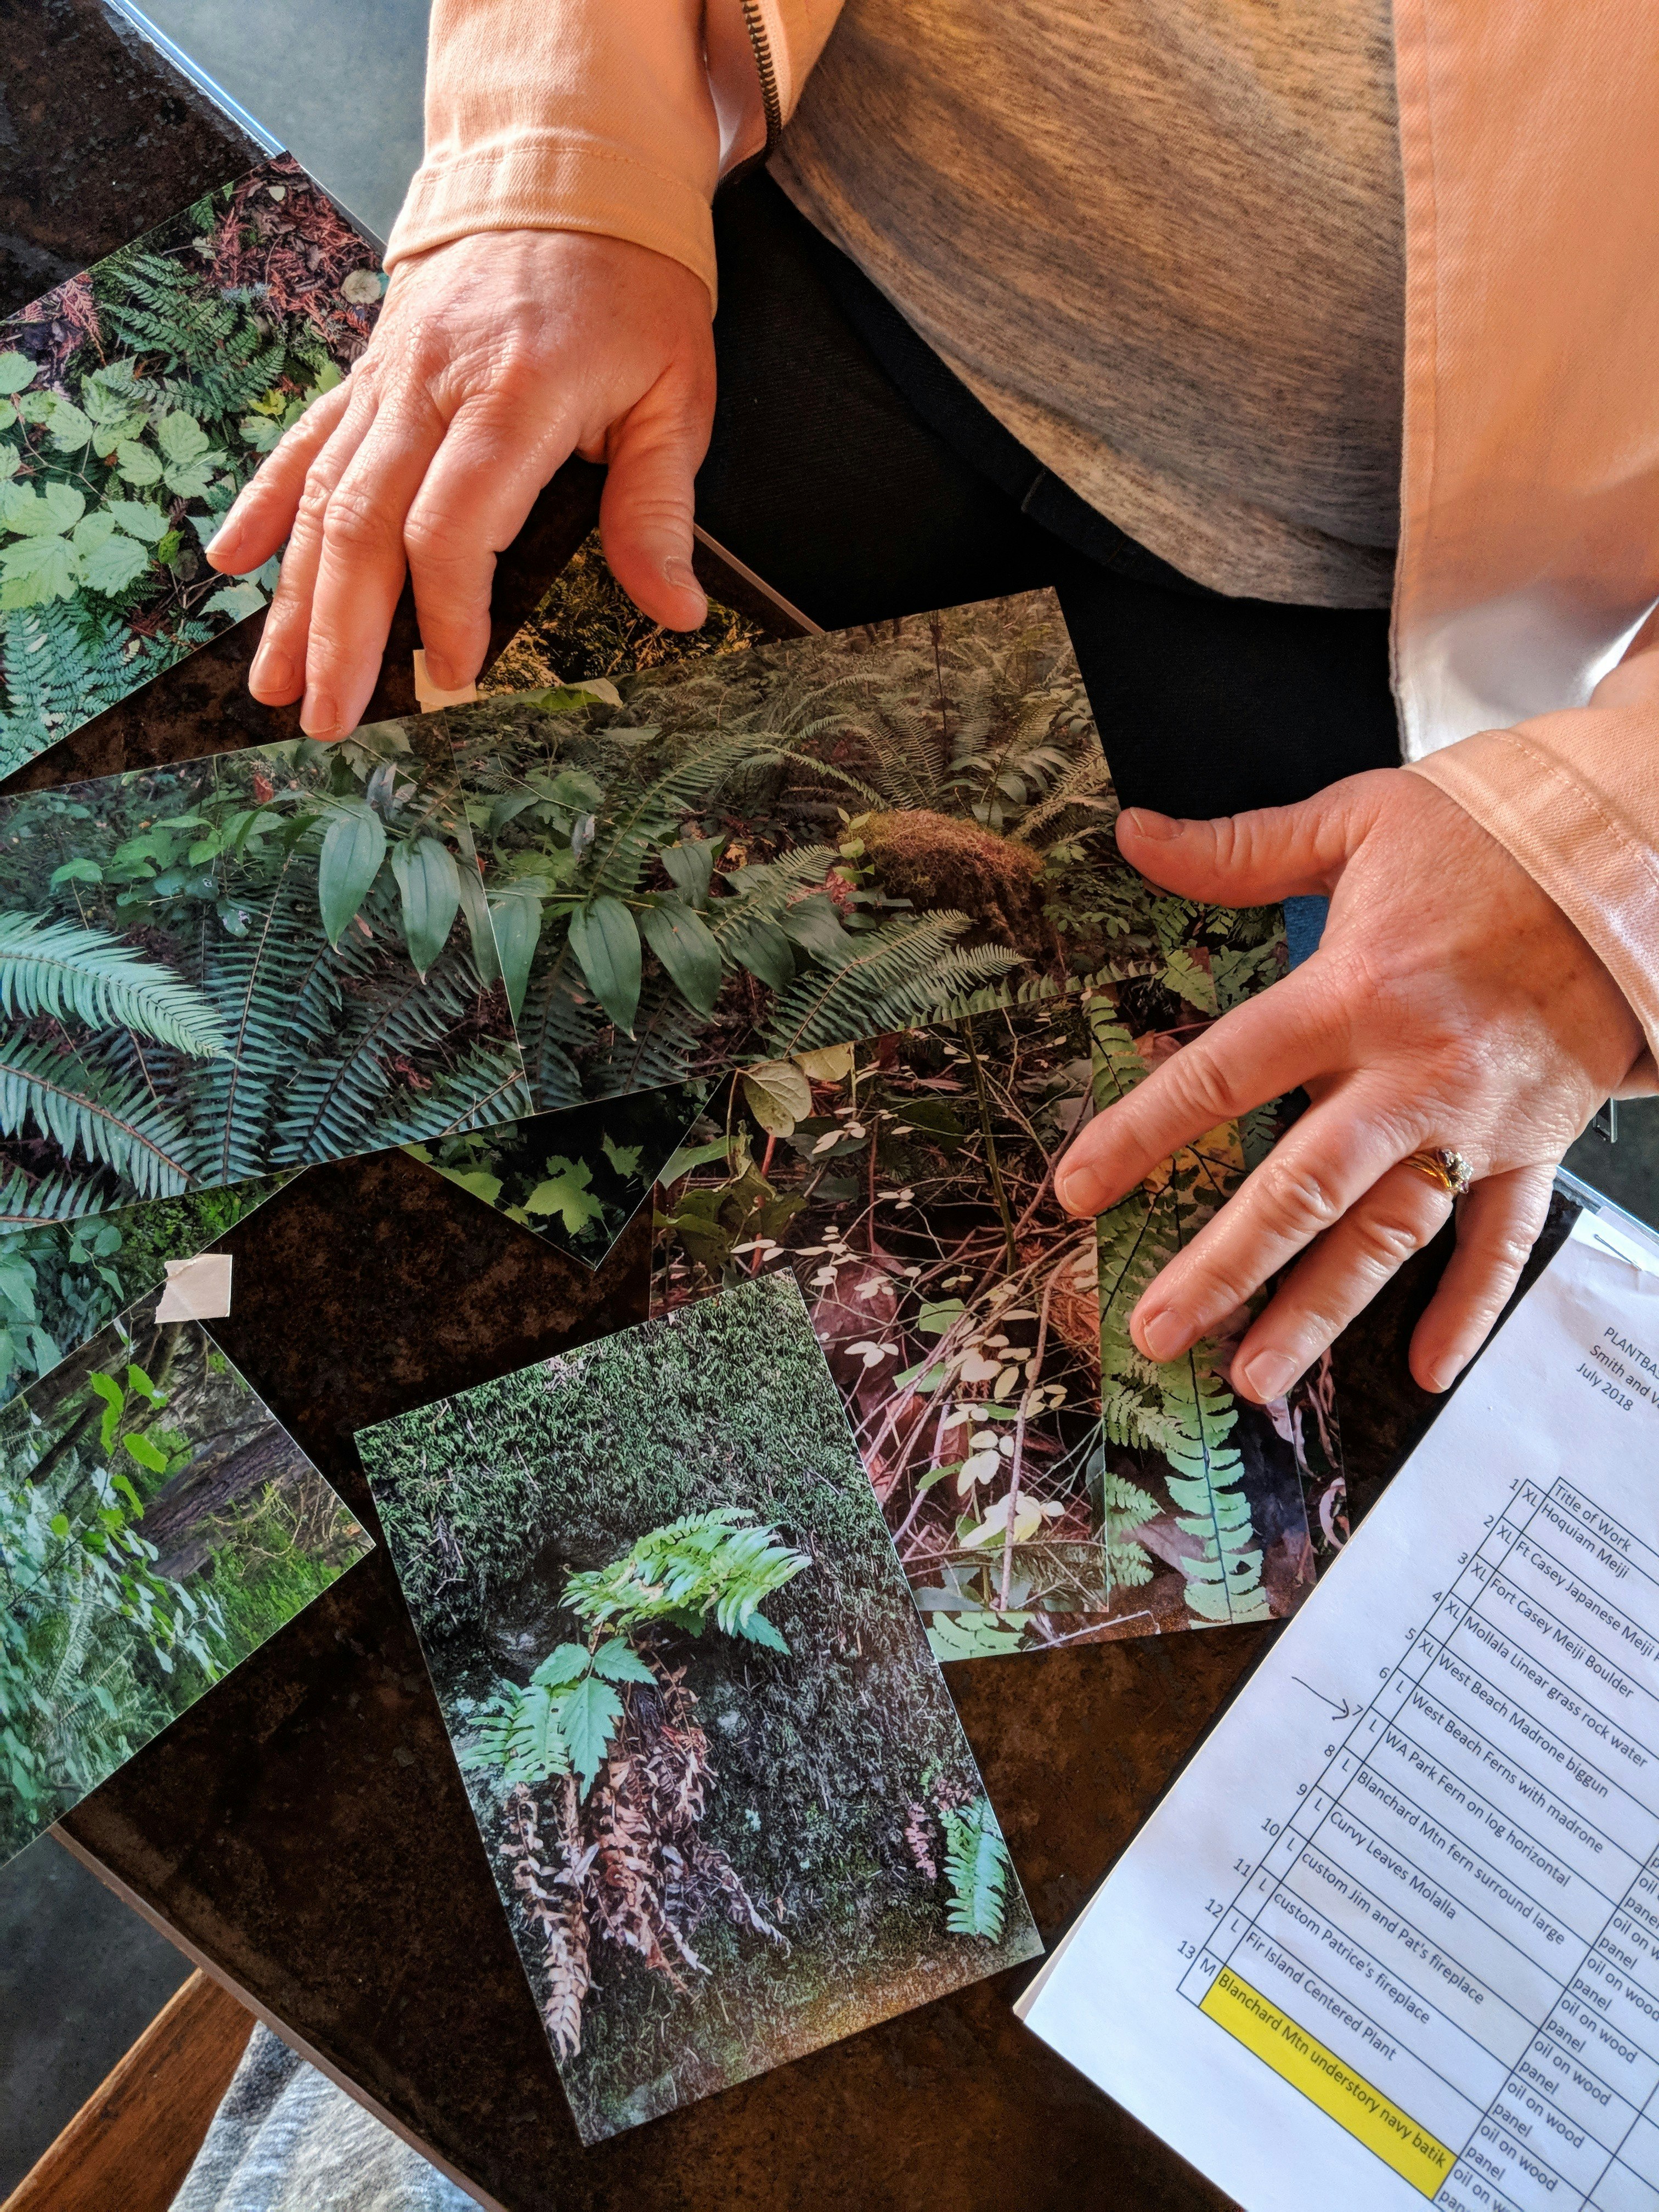
I like really complex forest, with a lot of different layers of plants. If I can find a good combination between depicting something that I actually see and a pattern that could represent it, I like doing that. I like thinking of patterns to represent things that line up along a transect. For instance, I could imagine all the fallow plants from here to Lake Washington, along this line. Any other way I can apply math or statistics to help myself out with the imagery.
I think about that a lot; if all of these leaves occupy Cartesian coordinates x, y and z. I could just say, ‘everything that represents y=x+5, no matter where it is, make that purple.’ It isn’t that I actually make these things, but I think about them. And I apply little bits back to whatever painting I’m working on.
So do you have the full composition in mind when you start?
I mainly have the full armature that I need to know it will be a good composition. That can be a quick sketch, or sometimes it’s really detailed sketches that I make ahead of time. Once that’s established on the panel, I’m making everything else up. I’ll take the photographs out if there’s some cool leaf shapes I want to include. Once I have the armature, I’m filling the spaces in between.
You talk on your blog about grouping the spaces, can you talk a little about that?
If I just choose some rule for myself about how I group things, I think it makes the whole look a lot more cohesive. So I work with a concept called Gesamkunstwerk, it’s German for ‘total work of art,’ the parts add up to the whole, the whole is cohesive, and the work of art should be interesting as a whole, and if you want to drill down.
That’s when I start thinking about finance, and all my spreadsheets, how you can have a summary spreadsheet but have all this stuff that is behind it, all these other sheets that can support your summary numbers. If you were showing an executive, ‘here’s our income statement,’ and he says ‘what about this expense line, what’s behind that?’ You’d be able to answer that question. All of these things I have to think about when I paint the forest, because it’s so complex. Most artists would just simplify things, like in a plein air painting, but this way, it’s more interesting to me. I’m trying to not bore myself. It’s rude enough to bore other people….
If I say, ‘that needs a fern in front of it,’ it’s not the fern, it needs something for your eye to follow. It’s not complex for complexity’s sake, it’s adding something to make it more interesting.
When you’re adding something to a painting, are you creating a function for it as you paint?
I’ll always think of rules for myself, but I’ll only use the rules for as long as it’s working for the painting. There always comes a point where it just becomes an intuitive color. Color is really the last thing I know I need to work on. So the only function that would work for me is to make it about color. Otherwise I think I’d break my rule.
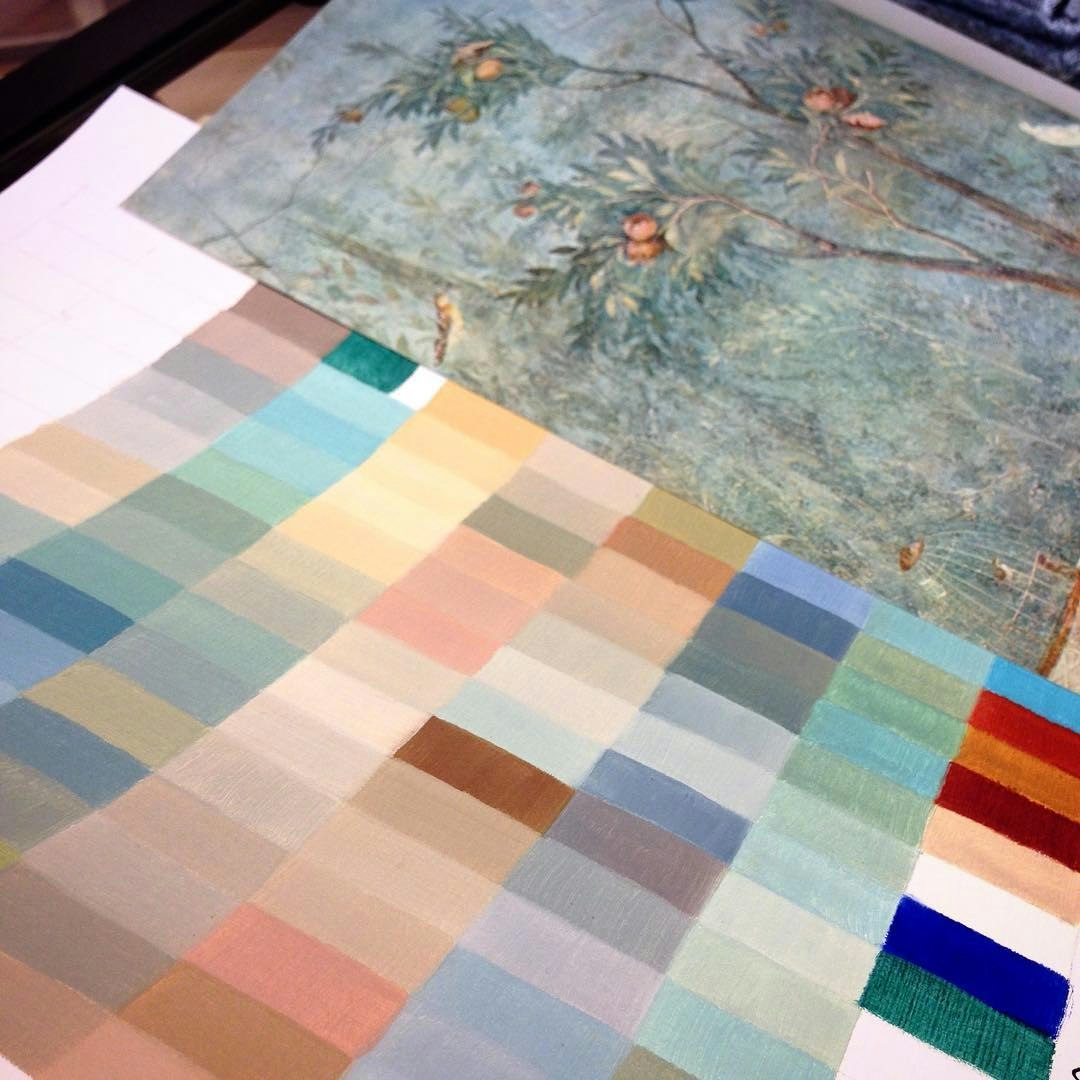
And you create color charts for old masters too. Can you talk about the placement of each shade?
It’s pretty randomized. I learned to do color charts where every rectangle in the grid was sort of predetermined because of what I have on the top and side of my piece. But those charts weren’t useful for me because I’d rather know, if I pick these five tubes of paint, what are all the possible combinations that might work for me and how do they look next to each other? So it works a lot better for me to just take my five tubes of paint, and that’s the top row, and these are all the mixtures below. So it’s all pretty random but to me, it’s very useful. I’ve been doing it for years, and I have binders full of color charts. I pull them out and that’s how I decide on color for a piece.
As an analyst, you ask questions of huge datasets. Do you assign a question or a problem to your project before you start working?
Sometimes I do, this is a good example:
I was asked to make some flower paintings which usually I don’t do, because as a woman painter, I don’t want to be pigeonholed. So if you look at my paintings there’s a lot of plants and trees, but actually the imagery is fairly macho. But when I was asked to make these flower paintings I was going up to Fir Island in Skagit Valley, where there are millions and millions of plants. So I’ll immediately start thinking of giant datasets.
I actually finished a painting last week that I called Fir Island Dataset. Because it reminds me of the concept in Big Data, can we save the entire population of data as individual points and let the data speak for itself? I ask myself all the time, am I letting the data speak for itself on the panel, or am I inserting myself, especially too early in the process, summarizing and simplifying the plants because it’s the only way I can handle it. The questions I ask myself are ways to extend the process, where I’m letting individual data points stay within their characteristics.
That makes sense.
Nobody’s ever said they understood what I was talking about!
I work for a Data Science firm, so it makes sense to me! But what are you using for each data point, is it one flower, or inflorescence?
Usually it’s a shape. I can’t think of too many things at once, so I use shapes. The scene itself is all green, so the color isn’t all too interesting to me. But if you look at the shapes, even in this small area, there’s hundreds of them. So I do think of each shape as being a data point. I’m not too literal about it, because I am just making marks with a brush, but I do try to make individual marks to represent an individual leaf shape. And again, it doesn’t have anything do do with the plants. It’s about preserving complexity.
So when you draw the eye to a line or pattern, are you focused on the aberrations or the similarities?
With what I call ‘eye path,’ I’m using typical artistic concerns, on how to divide your plane. I’m not thinking about aberrations in the plants, unless there’s one I want to call out. If it’s interesting, I’ll divide the panel in sections, and locate it within certain points. I know, from studying art, when this makes sense.
I spend a lot of time visualizing, but the painting always sort of takes over, and tells you what it wants. Through history there’s a lot of talk — from men — about battling the painting, and I’m much more gentle with my work. I get my way with the armature and the patterning, but then it almost feels like a conversation, where I’m asking it to help me see what it needs. It’ll be obvious if it’s not working.
Do you find that the processes you bring to painting, like making the simple more complicated, or listening to what the data’s trying to tell you, bleed into other aspects of your life?
It’s the other way around! I got my MBA when I was pretty young, so I’ve been reading the Wall Street Journal every day since I was twenty three years old. So it’s always been obvious to me, the concept of a summary and drilling down, or finding some detail and wondering what the conclusion about a population could be as a result. That comes naturally to me. I let that attitude inform my paintings.
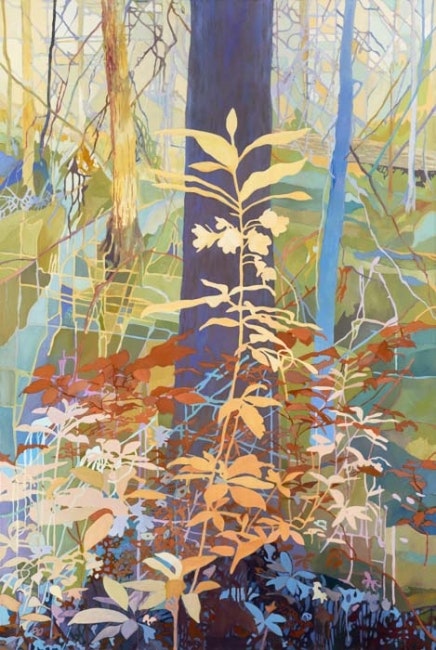
Madonna of the Back 40 oil on canvas, 60x40 Smith and Vallee Gallery’s January 2017 show
As a painter, I’m trying to be more of myself. And myself is an analytical person. I get frustrated with people who don’t have the patience to drill down every once in awhile. Or people who try to change the characteristics of a data population because of some idea they have, some narrative. I find that very common with artists. They have this concept of ‘how the world works,’ and it’s a decision tree they only allow three branches to grow. You get to a more interesting truth if you’re patient, and acknowledge that there’s more complexity. I didn’t learn that in business school, though.### Do you have any advice for people looking to bring Data Science and statistical processes to an area that might not already lend itself to those methods? Don’t go for the obvious. Fractal art, computer generated art is not something you should do if it’s not interesting to you. Some of the things I was talking about, with my coordinates, or my populations, it’s not obvious at first how to incorporate that. But if you just take your supplies and keep messing around, you’ll find some way to express it.
I’m really organized with my experiments, I take a lot of notes, I store them, and I think about how I want to work with them later. It was only when I was finding myself really bored with my work that I had to ask myself, ‘why do I find it boring, when it’s so enjoyable to everyone else?’ I realized it was because I wasn’t addressing my interest in complexity. I had the patience for it and the interest in it that other artists didn’t. I had to think about it for a long time.
Reading Big Data by Kenneth Cukier and Viktor Mayer-Schönberger is what did it for me, they would talk about the big populations of data and how we used to need statistical sampling to look at these populations. Because you’d never have the budget to measure everything. And I used to do this as a forester too, I did statistical sampling in the woods. With more computer power, you’re able to handle bigger populations of data without using these samples. In the extreme, your sample set could include every point. Everything could be measured and retain its original characteristics. That’s an extreme, and it’s theoretical, but reading it had a huge impact on me because I realized I don’t have to paint every leaf, as long as I conserve the complexity of the view. It’s empowering, and it’s respectful of the subject.
Patty Haller recently exhibited at Seattle Art Museum Gallery. Her next solo show is at Smith and Vallee Gallery in Edison WA, July 2018.
WorksHub
Jobs
Locations
Articles
Ground Floor, Verse Building, 18 Brunswick Place, London, N1 6DZ
108 E 16th Street, New York, NY 10003
Subscribe to our newsletter
Join over 111,000 others and get access to exclusive content, job opportunities and more!